September 2024 Release Notes
3 minute read
Data Plane Status for Gateways
A recent change to the data plane panel to display disconnected peers had the unintended side-effect that appliances acting as gateways would show a Degraded status if any of their clients wasn’t connected, even if that client was offline. As this is a pretty normal state the status was confusing for users. The data plane status indicator has been changed to only count the connections the node is responsible for initiating and does not count any inbound connections.
Layer 4 (L4) Improvements
- Flow logs are now displayed on both the Connector and Service nodes.
- Connectors on appliances now support an optional source block field to restrict access to the port.
- A “Copy to Clipboard” option has been added to the Actions of both the Connectors and Services tables. This will copy all the information about the selected connector or service to the clipboard to make it easier to share with others.

Copying a connector to the clipboard - Connectors can now be set to listen on the Bridge interface. This is useful if you want a container to be able to access a remote service via local port.

Bridge interface for connectors
Nodes Table
Role Column
This release adds a new option column called “Role” that will list if a node is configured to act as a gateway (public, private or hub) or only as an edge node client.

Node Table Fixes
This release resolves several issues with the Nodes table.
- Restores the ability to sort by additional columns like Tags, Clusters, etc.
- The “Tag Filter” dialog no longer blocks access to the tool bar at the top of the table.
- Nodes running outdated versions falsely reported the new Node Health Checks as
Unhealthy. This release changes this toUnknown
Uptime Metric
Appliances running version July 2024 version or newer will now display how long the OS has been online since the last reboot at the top of the Overview page.

User MFA Reset
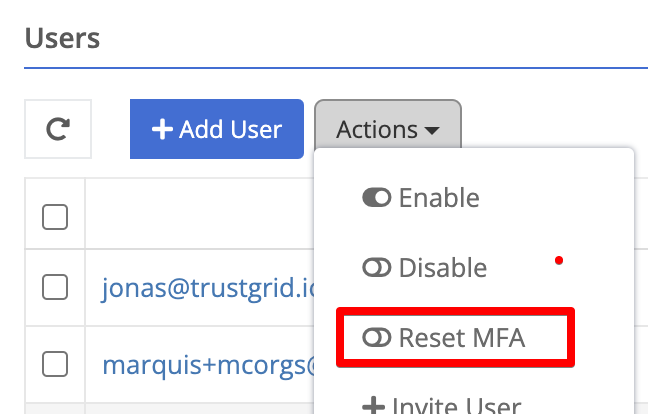
This release adds the ability of user with the users::modify permission, such as those with the builtin-tg-access-admin policy, to reset the multi-factor authentication of users in the Trustgrid user database. This reset is logged under Operation > Changes.

History Table Timestamps
With this release tables in the History section such as Events, Flow Logs, and Changes now display the second field of timestamps as well as the timezone offset used to display the user’s local time. This makes it easier to see exactly what order things occurred and clarifies what is being shown when screenshots are shared with users in different time zones.

Other Fixes and Improvements
- Resolves an issue where too many policies attached to a user/group prevented them from all displaying on the screen.
- The network interface “Disable” button has been removed on AWS, Azure and GCP nodes as this is not supported in those environments.
- The VPN Virtual Route Table now correctly sorts by additional columns like Path and Master.
- Incidents from Trustgrid’s Statuspage are now displayed at the bottom of the portal while the incident is on-going.
Feedback
Was this page helpful?
Glad to hear it! Please tell us how we can improve.
Sorry to hear that. Please tell us how we can improve.